
Development Tools
To debug JavaScript in your web content from our browser-based simulators first rebuild your app with Web Console Logs enabled. Then, on the simulator panel toggle toggle "Debug Mode" and click "Appetize". The JavaScript console for the app will be shown at the bottom of the window that opens. The "Debug Logs" tab will show the native app log output as well as the web console logs. Note: This option builds an unsigned debug build and must be disabled to build a signed APK/AAB for the Google Play Store.
Output to console.log(), console.warn(), console.error(), console.debug() will be displayed prefixed e.g. [console.log]. Note that other native app log data will also be output so it is important to check the prefix string.
Developer Demo
Display our demo page in your app to test during development https://median.dev/web-console-logs/
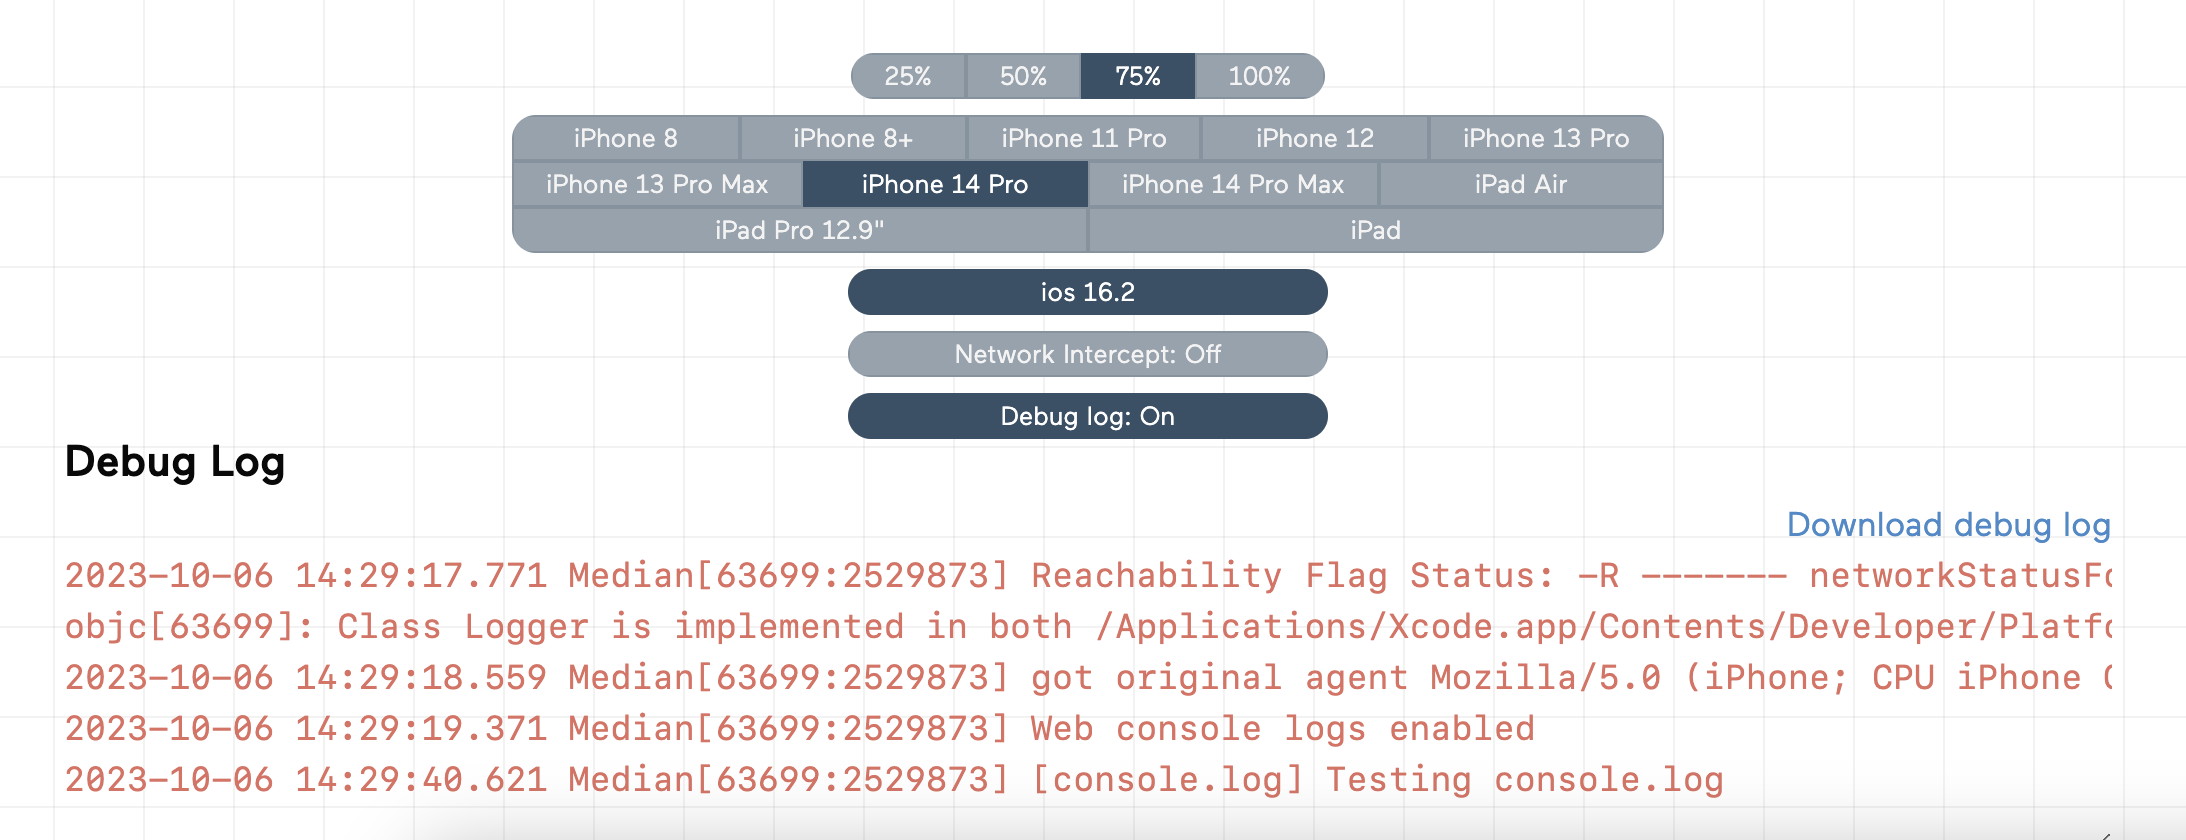
Viewing JavaScript console via Appetize
Android App Bundle was not signed
When Development Tools/Web Console Logs are enabled an Android debug build, i.e., an unsigned AAB, is generated by the Median build platform. If you attempt to publish this AAB to Google Play you will receive an error
The Android App Bundle was not signed. Web console logs must be disabled to build a signed Android app.
Updated 7 months ago